Insights Dashboard for your Screenshot Tests

It’s the end of summer, which means we’re getting closer to your dreaded quarterly reviews. Maybe you’ve spent the summer investing in testing, maybe in particular using Screenshot Tests, and you want to demonstrate the value that your tests have added.
With this in mind, we’re launching a simple dashboard on Screenshotbot with all the Insights that you might be interested in so that you can tell a better informed story about your testing.
We’re starting with these four charts, we don’t want to overwhelm our users. But we’re open to hearing your thoughts on what insights you might like to see. Here’s a description of the four charts, and our advice on how to interpret it.
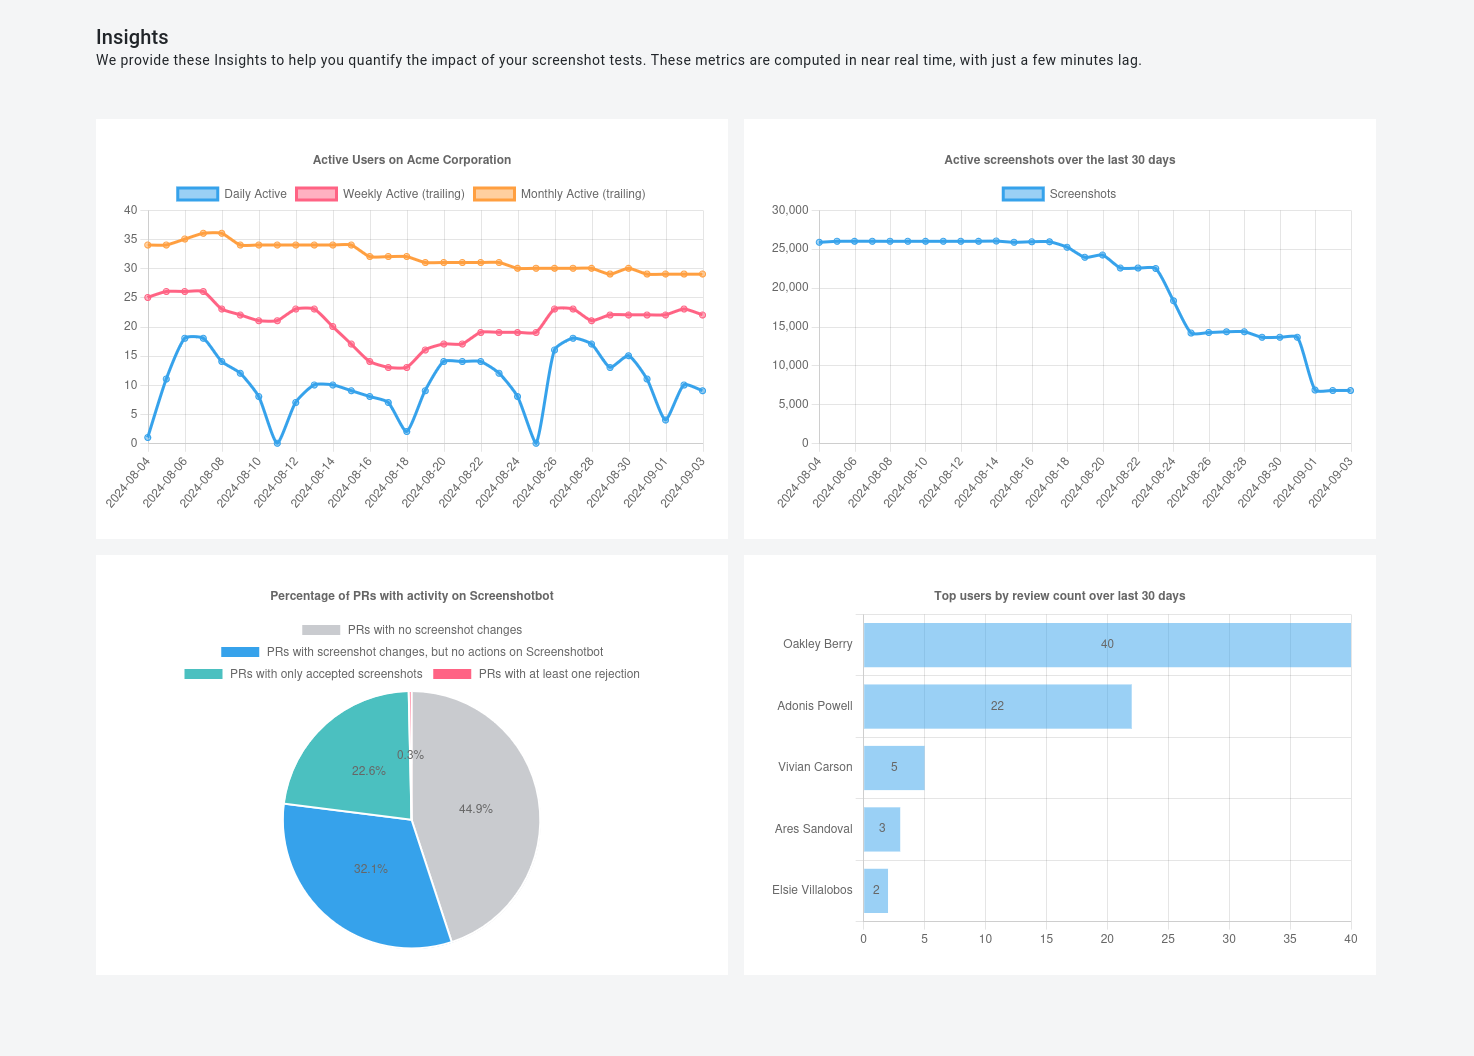
Active Users
This one is quite straightforward. Everyone understands what Monthly Active or Weekly Active users mean.
In the context of your screenshot tests, it shows how much your organization is aware of your screenshot tests. If the number is high, it shows that your screenshot tests are covering all the high-impact surfaces that get changed frequently.
By the way, we’ve found that our customers tend to vastly underestimate the number of people using Screenshotbot. In the past, we’ve manually had to generate this data and send it over. We’re excited that you have this at your fingertips now.
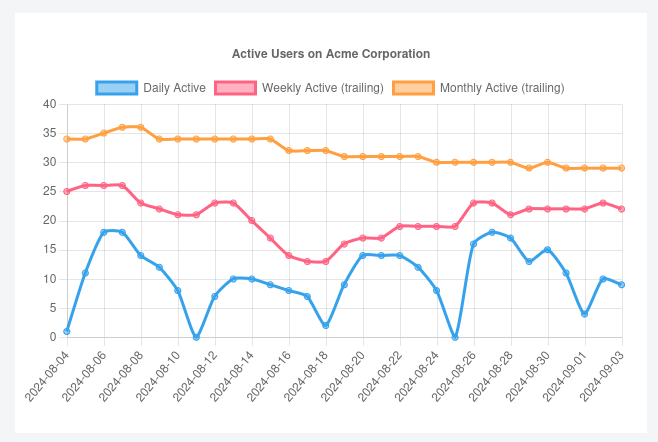
Active Screenshots
This is all the screenshots for which a run was uploaded in the last 30 days, whether or not the screenshot actually changed. For example, if you deleted a screenshot test with a specific name two months ago, it won’t count toward this even though that screenshot’s history is still stored in Screenshotbot. If you stopped updating a channel (perhaps because the project was shelved, or you deleted the code), it will stop counting toward this.
In particular, if you were previously storing your screenshots in Git or Git LFS, this would approximately correspond to the number of PNG files in your repository.
In general, you want this to go up. It’s also a useful metric if you’re in the process of migrating a repository with a large number of Git LFS screenshots to use Screenshotbot, and you want to keep track of the progress.
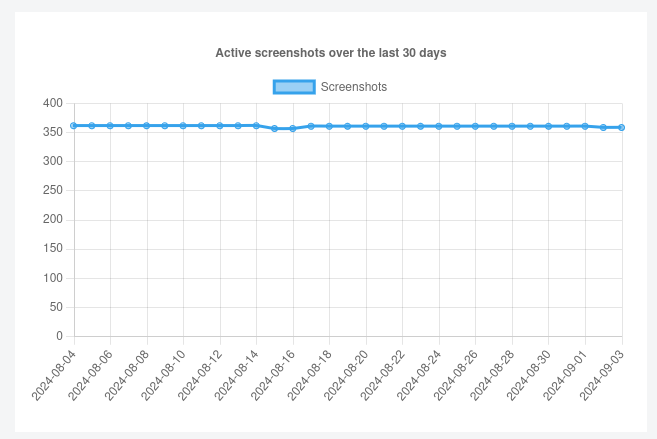
Pull Request Activity
This one is very specific to Screenshotbot, and is probably one of the best ways to demonstrate the value of your Screenshot tests, or perhaps even testing in general. When I was at Facebook, I tracked a metric similar to this very religiously and put it in all my Performance Review Cycles to form a story.
You see, unlike regular unit tests, Screenshot tests change frequently. Notice that I use the word “change” instead of “fail”. Unit-tests fail, screenshot-tests change. Not all changes are regressions. Unlike unit tests, when something changes in screenshot tests, looking through the changes provides value in itself to developers.
Since UI developers are getting paid to change the UI (duh), you’ll find that screenshot changes tend to be quite frequent. This chart will tell you:
- How often does a PR include UI changes? (For most companies, this will turn out to be a lot higher than you think.)
- How often is a change actually a regression? (For most companies, this is actually very low. Typically tends to be in the 1-2% range.)
We’ll also provide you a link so that you can lookup all the changes where the report was Rejected. This will let you use examples of where screenshot tests caught real regressions, which will help you convince people to invest more in testing.
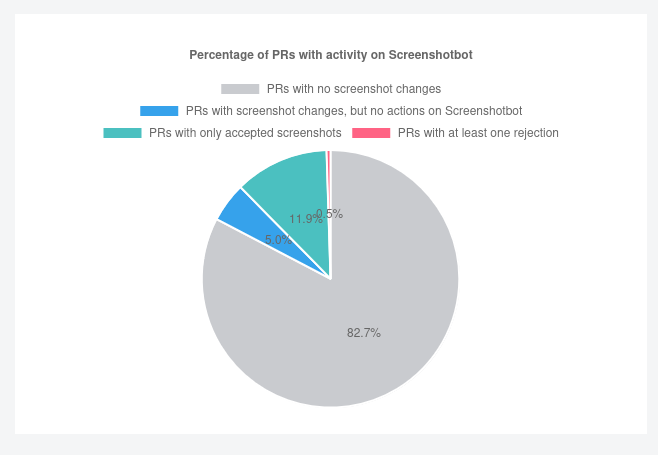
Top Reviewers
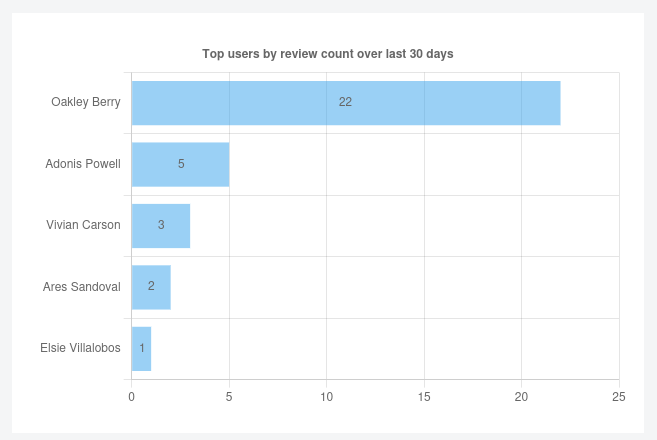
We keep track each time a user reviews a screenshot report, and show you the top reviewers in the last 30 days.
This isn’t mean to be a leader-board. The intention here is to give you a list of people you can reach out to to get qualitative feedback on your screenshot tests. This can be particularly useful if you’re on a Platform/DevEx team working on the tooling for screenshot tests, and want to get feedback about your tooling from developers who use and need it the most.
Need something more specific?
Just give me a ping at arnold@screenshotbot.io. As long as we can define the metric properly, we can probably provide it to you in a nice chart.
If you are a potential new customer, we hope you can use these metrics during our trial periods to validate the benefits of using Screenshotbot. In our experience, you’ll start seeing screenshot testing explode within just a few months. After all, everybody gets excited when Screenshotbot tells you exactly how your PR is affecting all the screens of the app, without any additional work for them to do.
Did you enjoy this post? Share the knowledge!